What is Prometheus?
Prometheus is an open-source systems monitoring and alerting toolkit. It collects and stores metrics as time series data, allowing for flexible querying and real-time alerting.
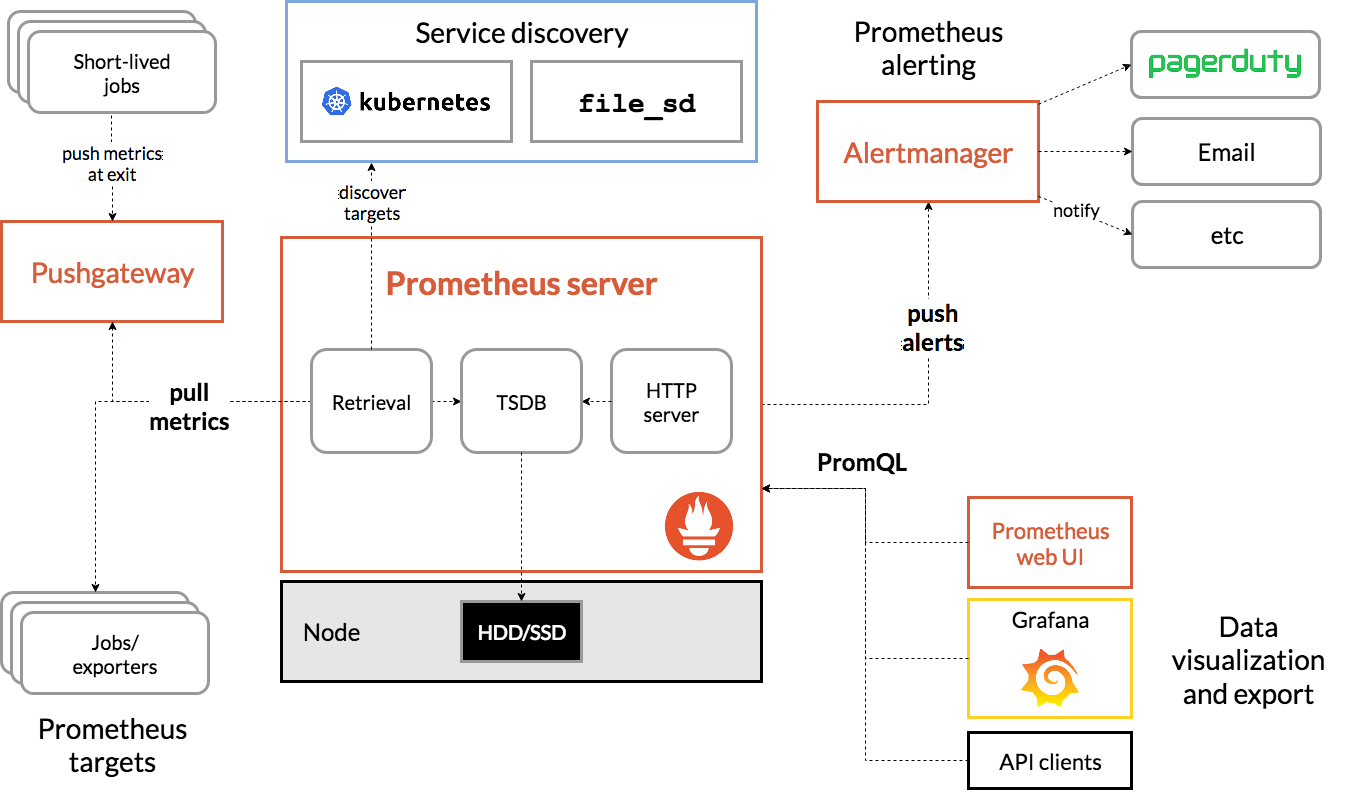
What are the main components of Prometheus?
The main components of Prometheus are:
- Prometheus server (for scraping and storing time series data)
- Client libraries (for instrumenting application code)
- Push gateway (for supporting short-lived jobs)
- Exporters (for services that don’t expose Prometheus metrics directly)
- Alertmanager (for handling alerts)
How does Prometheus collect metrics?
Prometheus uses a pull model to collect metrics. It scrapes metrics from configured targets at regular intervals, usually by HTTP endpoints on these targets.
What is PromQL?
PromQL (Prometheus Query Language) is Prometheus’s flexible query language that lets the user select and aggregate time series data in real time.
Explain the difference between counter, gauge, and histogram metric types in Prometheus.
- Counter: A cumulative metric that only increases (e.g., number of requests)
- Gauge: A metric that can increase and decrease (e.g., memory usage)
- Histogram: Samples observations and counts them in configurable buckets (e.g., request durations)
What is service discovery in Prometheus?
Service discovery is the process by which Prometheus automatically finds and monitors new targets in dynamic environments like cloud or container platforms.
How does Prometheus handle high availability?
Prometheus can be run in a clustered mode for high availability. Multiple Prometheus servers can scrape the same targets, and Alertmanager can be clustered to provide redundancy for alerts.
What is the role of Alertmanager in Prometheus?
Alertmanager handles alerts sent by client applications such as the Prometheus server. It takes care of deduplicating, grouping, and routing alerts to the correct receiver (e.g., email, PagerDuty, Slack).
How does Prometheus store data?
Prometheus stores data in a custom, efficient time-series database on local storage. It also optionally integrates with remote storage systems.
What is the purpose of exporters in Prometheus?
Exporters are used to export existing metrics from third-party systems as Prometheus metrics. They collect the metrics from the target system and translate them into a format that Prometheus can ingest.
How can you monitor Prometheus itself?
Prometheus can monitor itself by scraping its own HTTP endpoint. This allows you to track metrics about Prometheus’ own performance and behavior.
What is the difference between push and pull models in monitoring, and which does Prometheus use?
Prometheus uses a pull model, where it actively scrapes targets for metrics. In contrast, a push model involves targets actively sending metrics to the monitoring system. Prometheus’ pull model is simpler and allows for better detection of failures.
How does Prometheus handle labels?
Labels in Prometheus are key-value pairs associated with time series, e.g., environment="production", server="backend-01". They allow for multi-dimensional data model and flexible, powerful querying.
What is recording rules in Prometheus?
Recording rules allow you to precompute frequently needed or computationally expensive expressions and save their result as a new set of time series.
How does Prometheus ensure reliability and prevent data loss?
Prometheus uses local storage by default, which prevents data loss due to network issues. It also supports various service discovery mechanisms and can be run in a clustered mode for high availability.
Prometheus Underlying Data Structures
1. Time Series Database (TSDB)
- Custom-built for Prometheus
- Optimized for time-series data
- Supports efficient data compression and fast querying
2. Sample Data
Each time series consists of:
- Metric name
- Set of labels (key-value pairs)
- Timestamp
- Value
3. In-Memory Data Structures
- Inverted index: For quickly finding time series matching specific labels
- Sorted time series: Ordered by timestamp for efficient range queries
4. On-Disk Storage Structures
- Blocks: Data organized into fixed time ranges
- WAL (Write-Ahead Log): Ensures data durability and crash recovery
- Index: Stores metadata and label information for fast querying
5. Compression Algorithms
Prometheus uses various techniques to reduce storage space:
- Delta encoding: Storing differences between values
- XOR compression: For efficient compression of timestamps
- Varint encoding: For integer compression
6. Aggregation and Downsampling
- Supports data aggregation and downsampling for long-term storage
- Reduces precision and storage requirements of older data
7. Label Index
- Uses inverted indexing to quickly locate time series with specific labels