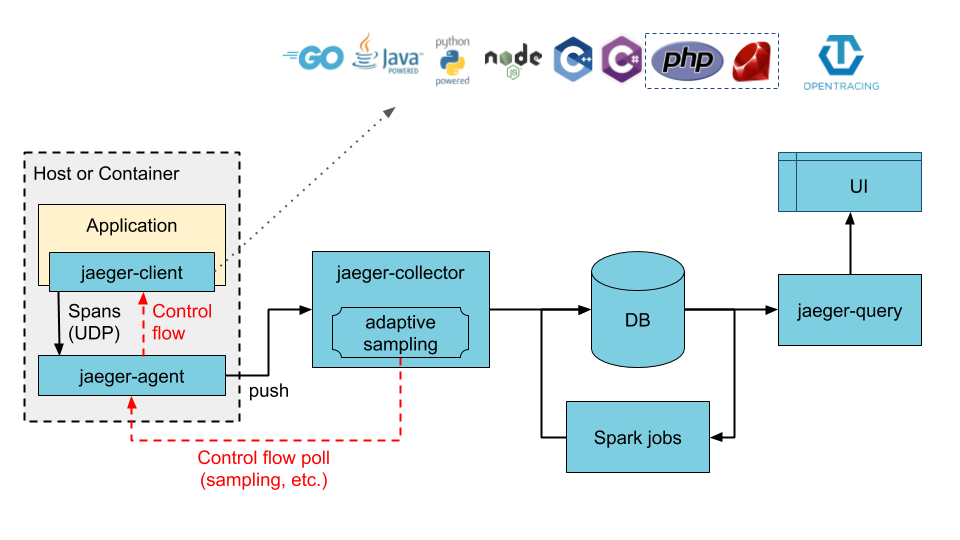
direct-to-storage architecture
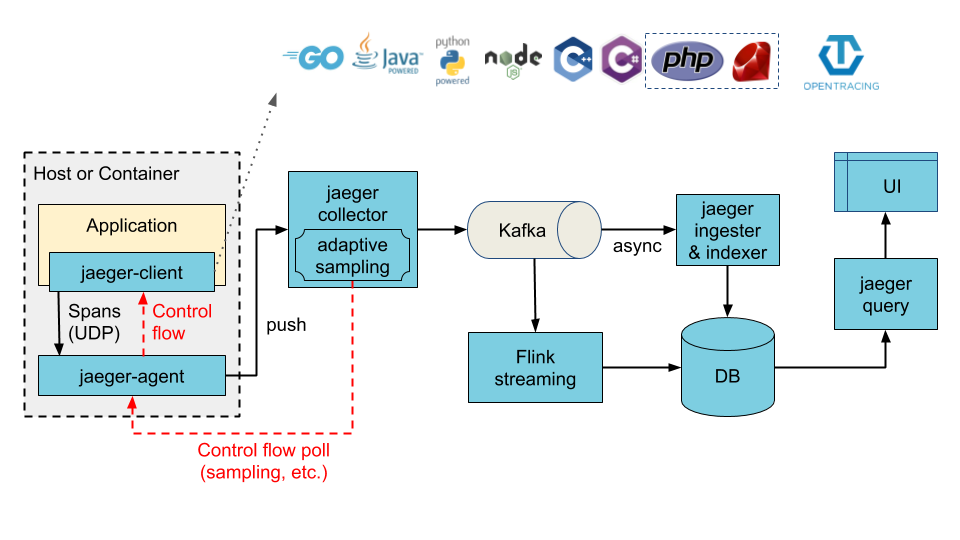
architecture with Kafka as intermediate buffer
What is Jaeger?
Jaeger is an open-source, end-to-end distributed tracing system. It helps monitor and troubleshoot transactions in complex, microservices-based architectures.
What problem does distributed tracing solve?
Distributed tracing helps in understanding the flow of requests through a distributed system, identifying performance bottlenecks, and diagnosing issues in microservices architectures.
What are the main components of Jaeger?
The main components of Jaeger are:
- Jaeger Client
- Jaeger Agent
- Jaeger Collector
- Query Service
- Ingester
- Jaeger UI
What is a span in the context of Jaeger?
A span represents a logical unit of work in Jaeger. It has an operation name, start time, and duration. Spans may be nested to form a trace tree.
How does Jaeger relate to OpenTracing?
Jaeger is compatible with OpenTracing, which is a vendor-neutral API for distributed tracing. Jaeger implements the OpenTracing specification.
What sampling strategies does Jaeger support?
Jaeger supports several sampling strategies:
- Constant (sample a fixed percentage of traces)
- Probabilistic (sample a percentage of traces with probability)
- Rate Limiting (sample up to a fixed number of traces per second)
- Remote (sampling decisions made by a remote service)
How does Jaeger handle data storage?
Jaeger can store trace data in various backends, including Cassandra, Elasticsearch, and in-memory storage.
What is the purpose of the Jaeger Agent?
The Jaeger Agent is a network daemon that listens for spans sent over UDP, batches them, and sends them to the Collector. It’s meant to be placed on the same host as the instrumented application.
How does Jaeger support multiple languages?
Jaeger provides client libraries for various programming languages, including Java, Go, Python, Node.js, C++, and others. These libraries implement the OpenTracing API.
What is the difference between metrics and traces?
Metrics are aggregated data about system behavior, while traces provide detailed information about individual transactions across a distributed system. Metrics are typically used for alerting and high-level system health, while traces are used for in-depth problem diagnosis.
How does Jaeger handle high cardinality data?
Jaeger uses adaptive sampling techniques to manage high cardinality data. It also allows for custom sampling strategies to be implemented.
What is the role of the Jaeger Collector?
The Jaeger Collector receives traces from Jaeger Agents and runs them through a processing pipeline. This pipeline validates traces, indexes them, performs any transformations, and finally stores them.
How can you integrate Jaeger with Kubernetes?
Jaeger can be deployed on Kubernetes using Kubernetes operators. It can also leverage Kubernetes’ service discovery mechanisms for automatic configuration.
What is the difference between logs, metrics, and traces?
- Logs are detailed records of discrete events
- Metrics are numeric measurements taken over time
- Traces show the path of a request through a distributed system
Jaeger focuses on traces, while systems like Prometheus handle metrics.
How does Jaeger handle trace context propagation?
Jaeger uses trace context propagation to pass trace information between services. This is typically done by passing certain HTTP headers between services.